
CRM Analyst Workbook · For CRM, retention and analyst roles
Work out every retention number your manager asks for, in one Excel file
Eight ready calculators, from repeat rate to what a customer is worth, each with practice data and plain notes. Even if Excel formulas scare you and you’ve never read a cohort table.
Free for the first 100 learners
One honest review in return. ₹299 after that.
of 100 places left · learners already in
No payment, no card. The folder link arrives by email in a minute.
- One Excel workbook, 8 calculators
- Self-study: learn at your own pace
- Practice data: 2,500 customers and 3,797 orders

Raviraj Ramavarapu
Founder, Compound Lab · 7 years in D2C and app marketing, most in CRM · has hired for CRM roles
“I built this from the work I do every day for brands. Practise it here before you do it on the job.”
- +79%revenue from lapsed usersHealthify
- 23% to 44%WhatsApp delivery in a monthCumin Co
- 77%of CRM revenue from automationsPNG Jewellers
- 39%of store revenue from CRMHealthify Store
- +43%return pickupsMyGate
- ₹27.6 Crrun-rate across Healthify, PNG Jewellers and DS MillRetention I’ve run









Who it’s for
It’s for you, even if spreadsheets scare you
- Bad with ExcelThe formulas are built. Change the yellow cells and read the answer.
- Numbers make you nervousEvery calculator tab has a “How to read it” note in plain words.
- No company data yetIt comes with a made-up coffee and tea brand’s orders to practise on.
- Never heard of RFMEach tab says what the number means and when you’ll be asked for it.
- Only have Google SheetsIt works there as it is. No Excel licence needed.
If you already build cohort and LTV models at work, you won’t find much new here. It’s for marketing CRM numbers, not sales pipeline reports.
What you walk in with
Eight numbers you’ll be able to work out and explain
- Answer “are people coming back?”Repeat rate with a time window, new and returning customers kept apart.
- Read a cohort table without guessingRead across to see a group fade, down to see if newer months do better.
- Say what a customer is worthLifetime value on what’s left after costs, not on revenue.
- Tell finance when ads pay backThe months a customer takes to cover the ₹640 it cost to win them.
- Pick who gets which messageScore every customer and sort them into groups like At risk and Lost.
- Call a test winner honestlySee if version B really won, or the gap could be luck.
- Prove what your messages addedCompare with people who got nothing, and count the extra orders.
- Write the formulas from memory35 metrics in one table, in words and as spreadsheet formulas.
Try one question
What would you tell your manager?
From the 1 Repeat rate tab · Practice data
Your manager asks: “Are people coming back?” The sheet says 28% of all customers ordered two or more times, and only 8 of June’s 371 new customers have ordered again. What do you say?
Practice numbers from Compound Lab Beverages, January to June 2026.
Pick the answer you’d give.
It mixes new and returning customers. Returning customers already came back once, so 71% of them repeat and pull the number up. It also has no time window.
That’s the answer. It names the window, keeps new customers apart and leaves out months that are too early to judge.
June customers have had only days to come back. Comparing them with January is one of the mistakes the tab warns about.
Why it works
A repeat rate means little until you say the time window and which customers you’re counting.
Say it like this
“Our 60-day repeat rate for new customers runs from 24% to 31%. Half of second orders come by day 35, so the reminder should go a little before that.”
That’s one tab of the workbook. See it as it is:
Try a calculator
See which messages really added orders
The Control groups tab compares people who got a series of messages with a random slice who got nothing. The gap is the orders your messages really added, the honest number to show finance.
What you get
- Reorder reminder: 6.9% bought after it, 3.0% without it
- About 2,664 extra orders from that one journey
- Welcome messages: 2.8% against 2.8%, so no proof they helped
- Only 42% of all journey orders were truly extra
Look inside
Real pages from the kit
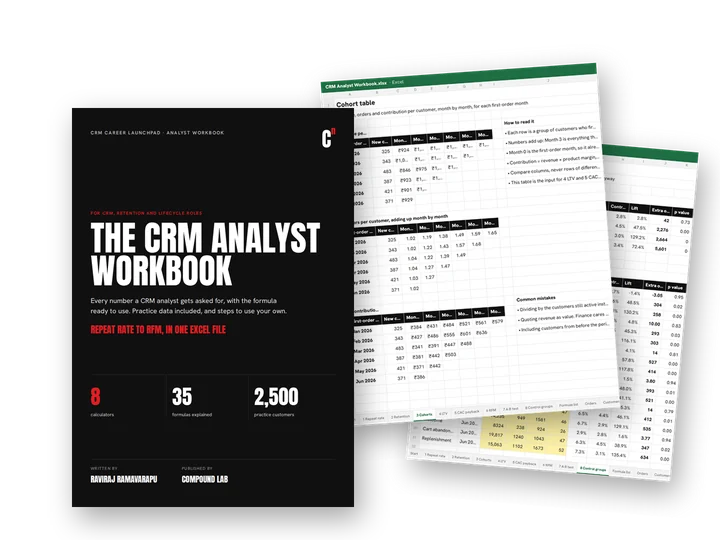
What each tab answers, and when you’ll need it
Repeat rate by first-order month, with a 60-day window
Revenue and orders per customer, month by month
What a customer is worth, and LTV against cost to win
Every customer scored and sorted into groups
Did B win, or could the gap be chance?
The extra orders each journey really added
Every metric in words and as a spreadsheet formula
What’s in the folder
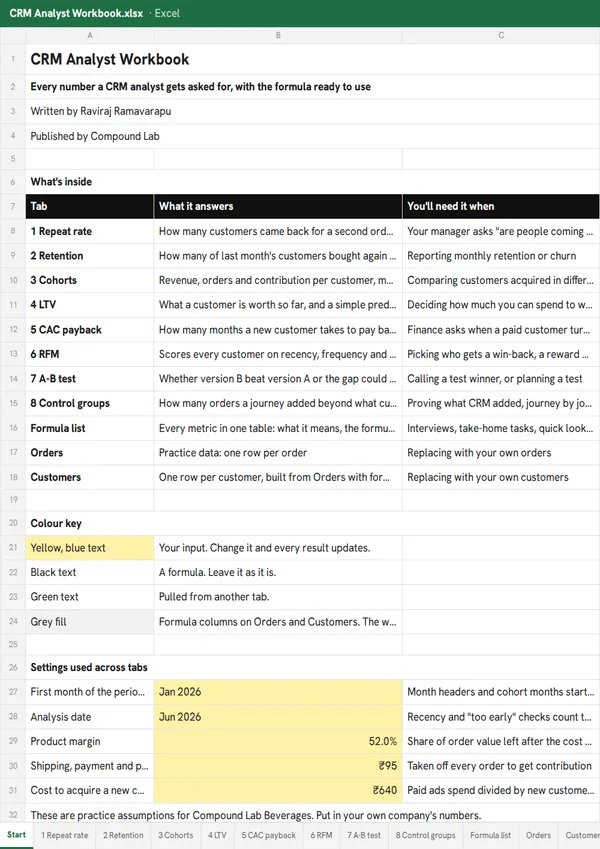
One workbook, eight calculators
Excel · 12 tabs
CRM Analyst Workbook
Eight calculators, a list of 35 formulas and practice orders, ready to swap for your own numbers.
Opens in Excel 2019, Microsoft 365 or Google Sheets.
The founding batch
Free for the first 100, for one honest review
- Get it freeName, email, WhatsApp. The link arrives by email in a minute.
- Use it for a weekOne tab a day: change inputs, read the notes.
- Tell me honestlyFour short questions. Good or bad.
After the founding batch, the Analyst Workbook sells for ₹299.
Questions, answered
I’ve never worked in CRM. Will this work for me?
Yes. It comes with practice data from a made-up coffee and tea brand, and every tab says what the number means and when you’ll be asked for it. No past job needed.
I’m not good with Excel. Is this too hard?
The formulas are already built. You change the yellow cells and every result updates, and a “How to read it” note sits beside each table.
How long does it take?
There are eight calculator tabs, so one a day takes just over a week. The Start tab has five short tasks to try first.
What do I get, and what opens it?
One Excel file with 12 tabs: eight calculators, a formula list, a start page and two data tabs. It works in Google Sheets as it is, and in Excel 2019 or Microsoft 365. Older Excel lacks two formulas it uses.
Is the data real? Can I use my own?
The data is practice data for a made-up brand: 2,500 customers and 3,797 orders. The Start tab shows, in nine steps, how to paste in your own orders.
How big should a control group be?
Work it out before the messages go live, with the test-size calculator on the A-B test tab. For example, if 4% usually order and you want to spot a 20% rise, you need 10,317 people in each group.
Who is this not for?
Analysts who already build cohort and LTV models, and anyone in sales CRM or Salesforce reporting. This is for marketing and retention numbers.
Why is it free right now?
The first 100 learners get it free as the founding batch, in return for one honest review after a week. After that it sells for ₹299.
Do I get a certificate?
No. You get numbers you can work out and explain, which is what interviewers and managers check.
CRM Analyst Workbook
Work out your first 60-day repeat rate tonight
Free for the first 100 learners
One honest review in return. ₹299 after that.
of 100 places left · learners already in
No payment, no card. The folder link arrives by email in a minute.
 CRM Career Launchpad
 CRM Interview Kit
 CV, LinkedIn and Portfolio Kit
 CRM Practice Projects
 Journey Blueprints
 The Message Museum
 How to Learn CRM Tools
 The CRM Prompt Pack
 CRM Glossary