
LTV:CAC Ratio for D2C: Formula, Payback, ₹ Example (2026)
LTV:CAC ratio for D2C brands, worked in rupees on CM2 margin instead of revenue. The CAC formula, blended vs new CAC, payback and why 3:1 misleads.
Updated October 2026.
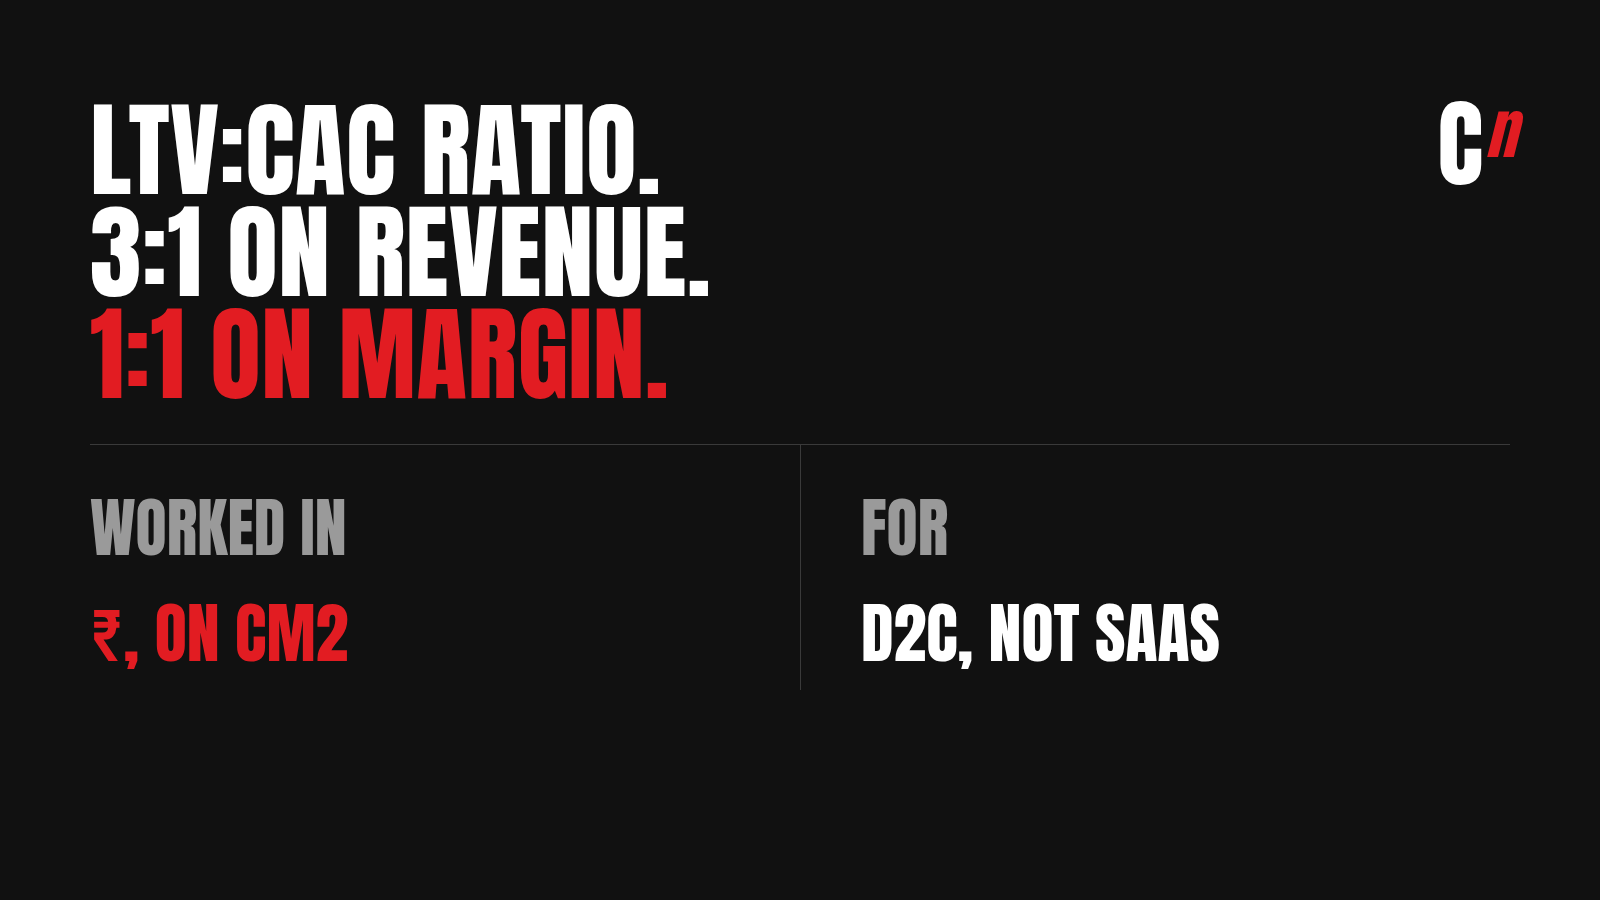
The LTV:CAC ratio is a customer's lifetime value divided by what it cost to acquire them. For a D2C brand, a "good" LTV to CAC ratio only means something when LTV is counted on contribution margin (CM2), because the 3:1 rule most founders quote came from SaaS, and a D2C brand at 3:1 on revenue can be close to 1:1 on margin, which means each new customer barely pays for themselves.
I led the HealthifyStore ecommerce business and its CRM, where customers acquired through Meta brought in roughly 2.8 times their acquisition cost in revenue, but only about 0.7 times once product cost, fees and fulfilment were taken out. The HealthifyStore repeat purchase case study shows what we did about it.
What a good LTV to CAC ratio means for a D2C brand
The ratio answers one question. For every rupee you spend to win a customer, how many rupees of profit does that customer return over their life with you?
Most guides say 3:1 is ideal. That benchmark comes from SaaS. David Skok's SaaS metrics guide sets "higher than 3" as the guideline, and the same guide says LTV should take gross margin into account, noting that most SaaS businesses run gross margins above 80%. At 80% margin, revenue LTV and margin LTV are close, so the shortcut does little harm.
A D2C brand doesn't keep 80% of revenue. After GST, product cost, shipping, payment gateway fees, COD returns and discounts, many keep somewhere between a quarter and a third of each rupee. Apply the 3:1 rule to revenue LTV at that margin and you are measuring a business that loses money on most customers.
So my reading of a good LTV:CAC ratio for D2C works in three bands, all on CM2.
- Under 1:1. Each customer costs more to acquire than they return. Growth makes the hole deeper.
- Around 1:1 to 1.5:1. Customers pay back their CAC but leave little to cover the team, the tools and rent.
- 2:1 and above. There is room to pay overheads and still grow. Where exactly you need to be depends on how heavy your fixed costs are.
Sources: David Skok, SaaS Metrics 2.0, Detailed Definitions, For Entrepreneurs.
Customer acquisition cost (CAC) formula, and why blended CAC flatters you
Customer acquisition cost is your marketing spend divided by the customers it brought in. The catch is which customers you divide by.
New-customer CAC = acquisition spend in a period ÷ new customers acquired in that period
Blended CAC = all marketing spend in a period ÷ all customers who ordered in that period, new and returning
Say a brand spends ₹4,00,000 on ads in a month. It wins 500 new customers, and another 300 returning customers also order that month.
- New-customer CAC is ₹4,00,000 ÷ 500 = ₹800.
- Blended CAC is ₹4,00,000 ÷ 800 = ₹500.
The blended number looks 37.5% cheaper. Returning customers didn't come from that spend, mostly. They came from your product, your emails and your WhatsApp journeys. Use new-customer CAC for LTV:CAC. Keep blended CAC, or marketing efficiency ratio, for a top-level health check.
How to calculate CAC correctly also means counting all of it. Include agency fees, creative production, influencer product costs and the affiliate commission if those exist only to bring in new buyers. Exclude CRM tools and retention sends, which belong to the customers you already have.
Customer lifetime value on revenue vs on CM2
Customer lifetime value on revenue is the easy version. Average order value times the number of orders a customer places over a period.
Revenue LTV = net AOV × average orders per customer over the period
CM2 LTV = CM2 per order × average orders per customer over the period
CM2 is what's left after product cost and every cost that moves with an order. I break the layers down in CM1, CM2 and CM3. Here is one order from a hypothetical brand.
| Line | Per order |
|---|---|
| Customer pays (incl. 18% GST) | ₹1,298 |
| GST out | ₹1,100 |
| Average discount | minus ₹100 |
| Net revenue | ₹1,000 |
| Product cost (COGS, 45%) | minus ₹450 |
| CM1 | ₹550 |
| Shipping | minus ₹100 |
| Packaging | minus ₹30 |
| Payment gateway (2%) | minus ₹20 |
| COD and RTO losses, spread over all orders | minus ₹60 |
| CM2 | ₹340 |
The COD line is the one most spreadsheets skip. If 30% of orders are COD and a fifth of those come back undelivered, you pay shipping both ways on 6% of all orders and earn nothing on them. Spread across every order, that's a real ₹60.
So of every ₹1,000 in net revenue, ₹340 survives to CM2. That 34% is the number your LTV should run on.
Now say this brand's customers place 1.95 orders each, on average, over 24 months, and its new-customer CAC is ₹650.
The same brand at 3:1 on revenue and about 1:1 on margin
| Measure | On revenue | On CM2 |
|---|---|---|
| Value per order | ₹1,000 | ₹340 |
| Orders per customer (24 months) | 1.95 | 1.95 |
| LTV | ₹1,950 | ₹663 |
| CAC | ₹650 | ₹650 |
| LTV:CAC ratio | 3.0:1 | 1.02:1 |
Same customers, same spend. On revenue, the founder sees a healthy 3:1 and raises the ad budget. On margin, each customer returns ₹13 more than they cost after two years, before a single salary is paid.
This is exactly what I found at HealthifyStore, with real data instead of a hypothetical. Meta-acquired customers returned roughly 2.8 times their CAC in revenue. After product cost, fees and fulfilment, about a quarter of each rupee survived, so the margin they returned was roughly 0.7 times what we paid to acquire them. Those figures are rough, because lifetime revenue and Meta CAC cover different windows, but the direction is not in doubt.
The same thing shows up when someone divides total revenue by total customers and calls it LTV. That number counts the GST you pass to the government and the product cost you paid your supplier as if they were yours to spend on ads.
CAC payback period for a repeat-purchase brand
Most CAC payback guides assume a subscription, with the same monthly revenue every month. A D2C brand gets paid in lumps, one order at a time, and only some customers come back. So work payback out per order, then per cohort.
CAC payback (orders) = CAC ÷ CM2 per order
With CAC at ₹650 and CM2 at ₹340 an order, a customer's first order recovers 52% of what you paid to acquire them. If they come back for a second order, that one clears the remaining 48% and leaves ₹30 over. Every order after that is profit at CM2.
That's the individual customer. The cohort is slower, because most customers never place a second order. Take 100 customers acquired in the same month, at ₹65,000 total CAC.
| Months since first order | Cumulative orders | Cumulative CM2 | Share of CAC recovered |
|---|---|---|---|
| 0 | 100 | ₹34,000 | 52% |
| 3 | 135 | ₹45,900 | 71% |
| 6 | 160 | ₹54,400 | 84% |
| 12 | 180 | ₹61,200 | 94% |
| 24 | 195 | ₹66,300 | 102% |
The cohort pays back at about 24 months. That's two years of cash tied up in every new customer, which is why a brand can grow fast and still run out of money.
So what is a good CAC payback period? For D2C, recovering CAC on the first order, or within the first few months, is the safe zone. Past 12 months, you are funding your customers' indecision with your own working capital.
A note on one widely read payback guide. CFI's ecommerce example states a payback of about 13.33 months, but its own inputs ($150 CAC, $25 a month per customer, 75% margin) work out to 8 months. If you copy a template, check the arithmetic.
Sources: Corporate Finance Institute, CAC Payback Period, Example 3, checked October 2026.
Channel-level LTV:CAC: not every customer is worth the same
One blended LTV:CAC hides the fact that channels bring in different people. At HealthifyStore, customers who came through the app were worth about twice as much as customers acquired through Meta. The difference is intent.
CAC moves too. Our Meta CAC rose by almost half in three months, while the average basket fell slightly. A ratio you calculated in January was wrong by April.
Reported ad numbers make it worse. Retargeting ads claim orders that would have happened anyway. When we modelled it, a healthy-looking reported retargeting ROAS shrank a lot once those cannibalised orders were taken out. That means true CAC was higher than the dashboard said. A global control group is the clean way to measure this for your own CRM sends.
Here is how a channel view might look for the hypothetical brand.
| Channel | New-customer CAC | CM2 LTV (24 months) | LTV:CAC on CM2 |
|---|---|---|---|
| Meta | ₹800 | ₹580 | 0.7:1 |
| Google search | ₹600 | ₹700 | 1.2:1 |
| Organic and app | ₹250 | ₹1,100 | 4.4:1 |
Run this split before you move budget. Check what your ad platform's ROAS has to be to clear CM2 with the break-even ROAS calculator.
Choose your hero right: what you acquire on sets the ratio
In early 2026, Healthify switched from growth to profitability. In my words at the time, you get fewer people, but at a much more profitable margin. When we read the accounts, the problem was plain. We were so invested in acquiring new customers that we never focused on bringing back and repeating the ones we already had.
Part of it was the hero product. The smart scale was the first purchase for over half of our customers, and very few of them came back. You can't own two smart scales. The ads were efficient at selling a product with no second order behind it, so the LTV side of the ratio was capped before the customer even arrived.
The question I now ask every brand is this one. What can make your customer come back to you again and again? A kadhai buyer can come back for a dosa pan or a tawa. A rakhi buyer won't return for a year. You need to look at the chronology of selling things in a much smarter way. You need to choose your hero right.
So we pushed repeat products, like whey that runs out in about 30 days, over one-time SKUs, and used the scale buyers as a cross-sell audience into refill categories. The replenishment and cross-sell journeys post covers how to time those.
How retention changes the LTV:CAC ratio
CAC is mostly set by the market. LTV is mostly set by you. That's why retention is the bigger lever for most D2C brands.
Go back to the hypothetical brand. If 10 more customers out of every 100 place one extra order in the first year, orders per customer rise from 1.95 to 2.05. CM2 LTV rises from ₹663 to ₹697. The ratio moves from 1.02:1 to 1.07:1. Small, but it compounds, because a customer who makes a second order is far more likely to make a third.
Five ways to lift the ratio, starting with the cheapest.
- Fix the second order first. Most cohorts lose the bulk of customers between order one and order two. A post-purchase flow that explains the why and the how of the product does more here than any discount.
- Time replenishment to the product. If a tub lasts 30 days and delivery takes two, remind on day 25.
- Watch your discounts. Repeat revenue bought with heavy coupons raises revenue LTV and can lower CM2 LTV.
- Cut COD losses. Every RTO you prevent adds straight to CM2 per order, which shortens payback.
- Acquire on the right products. Spend behind the products that lead to a second purchase, even if their first-order ROAS looks lower.
To see where your own customers drop off, track them by acquisition month with cohort analysis, and compare against repeat purchase rate benchmarks. The wider playbook is in retention marketing. When you have your numbers, run them through the LTV calculator.
How to reduce CAC without breaking the ratio
Reducing CAC usually means cutting spend on the least efficient audiences. That's fine, as long as you judge efficiency on CM2 LTV, not first-order ROAS.
- Cap retargeting frequency and test it against a holdout before trusting its ROAS.
- Move spend toward entry products with a proven second order.
- Raise first-order CM2 with bundles and thresholds rather than flat percentage discounts.
- Grow owned channels (app installs, WhatsApp opt-ins, email) so returning orders cost you a message, not an ad.
Where I fit
Most D2C brands I speak to know their ROAS by the hour and have never worked out LTV on CM2, so they scale channels that lose money on every customer. Compound Lab is a retention agency, and fixing the LTV half of that ratio is the job. Book a 30-minute call and we'll work out your LTV:CAC on margin, by channel, with your own numbers.
FAQ
What is a good LTV to CAC ratio? For a D2C brand, judge the ratio on contribution margin (CM2), not revenue. Under 1:1 on CM2 means customers cost more than they return, around 1:1 to 1.5:1 covers acquisition but little else, and 2:1 or better leaves room for overheads and growth.
Why is 3x LTV CAC considered good? The 3:1 guideline comes from SaaS, where gross margins are often above 80%, so revenue LTV and margin LTV are close. A D2C brand that keeps a third of each rupee after costs can be at 3:1 on revenue and only about 1:1 on margin.
How do you calculate LTV and CAC? CAC is acquisition spend in a period divided by new customers acquired in that period. LTV is CM2 per order, after GST, product cost, shipping, gateway fees, COD losses and discounts, multiplied by the average number of orders a customer places over a set period such as 12 or 24 months.
What is considered a good CAC payback period? For a repeat-purchase D2C brand, recovering CAC on the first order, or within the first few months, is the safe zone. Past 12 months, the brand is funding customer acquisition out of its own working capital for a long time, which limits how fast it can grow.
How do you calculate the CAC formula? Divide marketing spend aimed at acquisition, including agency fees and creative costs, by the number of new customers it brought in. For example, ₹4,00,000 in spend that wins 500 new customers gives a CAC of ₹800. Dividing by all ordering customers, including returning ones, gives blended CAC, which looks cheaper but overstates efficiency.
What's a good CLV to CAC ratio? CLV and LTV are the same measure, so the same bands apply. On CM2, aim for at least 1:1 within your payback window and 2:1 or better over the customer's life, and check the ratio by acquisition channel, because a blended figure can hide a channel that loses money. Compound Lab can work this out with your numbers on a 30-minute call.
What is a customer acquisition cost example? Say a brand spends ₹3,00,000 on ads in a month and gets 500 new customers. CAC is ₹600. If those customers' first orders leave ₹350 of contribution after product, shipping, fees and discounts, the first order recovers about 58% of CAC and the second order has to recover the rest.
What is a good CAC ratio? There's no single good CAC on its own. Judge it against what a customer earns you: at minimum, first-order contribution plus expected repeat contribution should cover CAC within your cash payback window.
Not sure if your ads are buying customers or losing money on them? Book a 30-minute call.