WhatsApp, Email, Push Statistics India 2026
60+ WhatsApp, SMS, email, push and ecommerce statistics for India in 2026, each linked to its source, plus the numbers nobody publishes.
Updated October 2026. Every number checked between 1 and 13 October 2026.
This page collects more than 60 statistics for marketing to customers in India in 2026: WhatsApp, SMS, email, push, apps, online shopping and the consent law. Each number links to the organisation that produced it, says when it was measured, and says whether it covers India or the world. Where a number people often quote has no real source, this page says so instead of repeating it.
I'm Raviraj Ramavarapu, founder of Compound Lab, a retention agency for D2C brands and consumer apps. I use these numbers to plan budgets and set targets with the brands I work with, and they have to hold up when a founder asks where they came from. Most statistics pages online are written by companies selling the channel they're measuring, and many repeat figures with no method behind them. This one is built so you can check every line.
The 15 numbers to know
| Number | What it is and where it comes from |
|---|---|
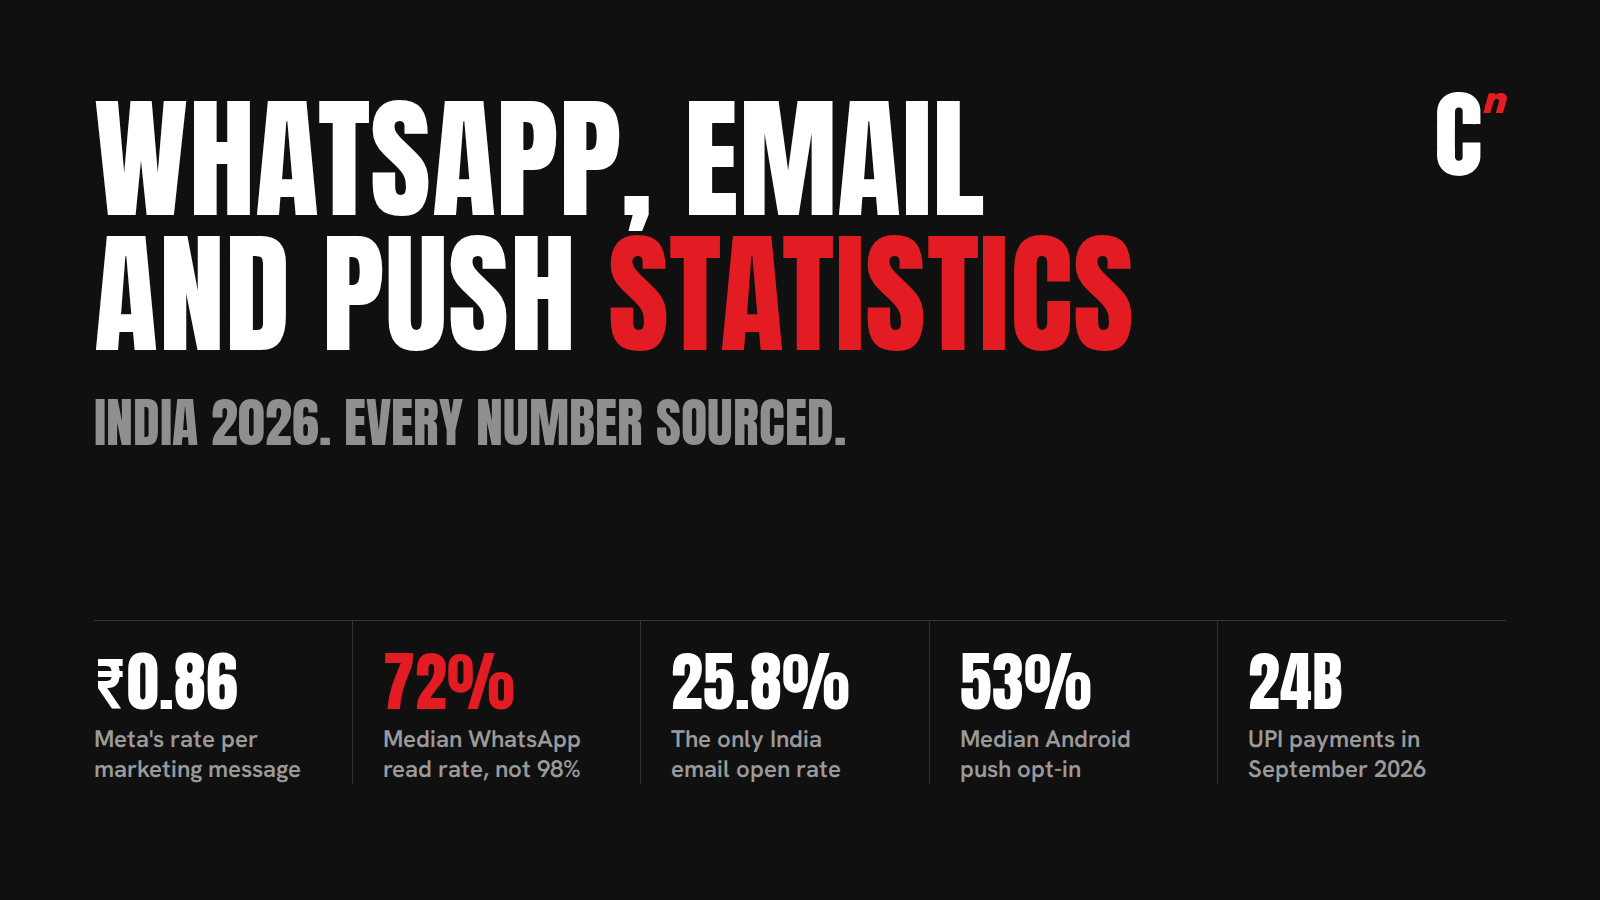
| ₹0.8631 | Meta's rate per delivered WhatsApp marketing message to an Indian number, before GST, from 1 October 2026 Source: Meta |
| ₹0.115 | Meta's rate per utility, authentication or service message in India Source: Meta |
| 250 to unlimited | Meta's daily messaging limits per business: 250, 2,000, 10,000, 1,00,000 or unlimited people a day Source: Meta |
| 72% | Median WhatsApp read rate across 414 brands. The often-quoted 98% has no published method Source: Chatarmin, not India |
| 62.0 lakh | Indian WhatsApp accounts banned in August 2026 Source: WhatsApp India monthly report |
| 115.3 crore | Mobile connections in India, excluding machine-to-machine SIMs, August 2026 Source: TRAI |
| 1,83,839 | Telecom connections disconnected or barred for spam, April to June 2026 Source: TRAI |
| 0.30% | The spam rate Gmail says bulk senders should never reach. Aim for under 0.10% Source: Google |
| 25.84% | The only published email open rate for India, from one provider's 2023 data Source: GetResponse |
| 53.3% | Median push opt-in rate on Android in 2025. iOS: 48.85% Source: Airship, global |
| 78.8% | Share of Android web traffic in India on Android 13 or later, where apps must ask before sending push Source: StatCounter |
| 290 to 300 million | People in India who shop online, 2025 Source: Bain and Flipkart |
| 24.07 billion | UPI transactions in September 2026, up 23% on a year earlier Source: NPCI |
| 72% | Share of Meesho's shipped orders paid by cash on delivery, April to September 2025 Source: Meesho's IPO filing |
| ₹250 crore | Highest penalty under India's data protection law. Its consent rules apply from 13 May 2027 Source: PIB |
Want to quote a number? Each section has a "Copy citation" button, and the full dataset is a CSV download.
WhatsApp statistics for India
WhatsApp is the channel Indian brands talk about most and measure least well. The rates and limits below come from Meta's own documentation. The user and read-rate numbers need more care, so each one says exactly where it comes from.
| Statistic | Number and source |
|---|---|
| Marketing message rate, India | ₹0.8631 per delivered message, before 18% GST, from 1 October 2026 Source: Meta pricing |
| Utility and authentication rate, India | ₹0.115 per delivered message Source: Meta pricing |
| Service replies | 1,000 free per business phone number a month from 1 October 2026, then ₹0.115 each Source: Meta pricing |
| Pricing model | Per delivered message since 1 July 2025. Before that, Meta charged per 24-hour conversation Source: Meta pricing |
| Daily messaging limits | 250 for new businesses, then 2,000, 10,000, 1,00,000 or unlimited unique people in 24 hours Source: Meta messaging limits |
| How limits are set | Per business portfolio, shared across all its numbers, since 7 October 2025. The old 1,000 tier was removed Source: Meta changelog |
| Marketing messages one person can receive | No number published. Meta caps it per person, based on how often they read marketing messages Source: Meta per-user limits |
| Where that cap applies | India and most countries. Not active in the EEA, UK, Japan or South Korea Source: Meta per-user limits |
| Blocked by the cap | Shows as error 131049. Meta says wait at least 24 hours before resending Source: Meta per-user limits |
| WhatsApp users in India | Not published by Meta since 2019. Last figure: more than 400 million monthly users (July 2019). A government figure of 53 crore (February 2021) came from third-party data Source: TechCrunch, PIB |
| Median read rate per brand | 72.05%, across 414 brands and 11.8 million messages. Weighted by messages: 79.6%. Not India: the brands use a WhatsApp tool focused on German-speaking markets Source: Chatarmin |
| Accounts banned in India | 62,02,400 in August 2026, of which 16,90,800 before anyone reported them Source: WhatsApp India monthly report, via MediaNama |
| User complaints to WhatsApp India | 27,085 in August 2026 Source: Same report |
| People who get unsolicited business messages on WhatsApp every day | 96%. 19% get eight or more a day. 59% block the sender Source: LocalCircles survey, February 2026, 42,000+ responses |
What the read rate means. Chatarmin's study counts read receipts, so people who turned receipts off don't show, and the real rate is a little higher. It covers customers of Chatarmin, a WhatsApp tool focused on German-speaking markets, and manual campaigns rather than automated flows, so it isn't an India number. Even so, it's the only published study with a stated method, and it found that no account reached 98% as a campaign average. Until an India study exists, 70% to 80% is a fair planning range for customers who opted in. Measure your own and replace it.
What the cap means in practice. The per-person cap is the reason a list of 1 lakh doesn't receive 1 lakh messages. At Cumin Co, fixing the sends that kept hitting it took WhatsApp delivery from 23% to 44% in a month. I explain the fix in WhatsApp error 131049, and the full rate card in WhatsApp API pricing in India.
SMS and DLT statistics
Every commercial SMS in India passes through TRAI's DLT system, and TRAI now publishes enforcement numbers every quarter. These are the most reliable spam figures in the country, because they come from the regulator itself.
| Statistic | Number and source |
|---|---|
| Mobile connections | 115.29 crore excluding machine-to-machine SIMs. 129.34 crore including them. August 2026 Source: TRAI |
| Broadband connections | 110.12 crore, August 2026 Source: TRAI |
| Total telephone connections | 136.07 crore, August 2026 Source: TRAI |
| Connections disconnected for a year for spam | 46,786, April to June 2026 Source: TRAI |
| Connections barred for 15 days, first offence | 1,37,053, April to June 2026 Source: TRAI |
| Senders blacklisted for a year | 263, April to June 2026 Source: TRAI |
| Spam complaints registered | 10.85 lakh, April to June 2026 Source: TRAI |
| SMS headers blocked | 2,873, April to June 2026 Source: TRAI |
| Preferences on the Do Not Disturb registry | 22.4 crore, as of 30 June 2026 Source: TRAI |
| Complaint window | 7 days after receiving the message, up from 3, since TRAI's February 2025 amendment Source: TRAI |
| When action starts against a sender | 5 complaints in 10 days, down from 10 in 7 Source: TRAI |
| Header suffixes | -P promotional, -S service, -T transactional, -G government Source: TRAI |
| Typed variables in templates | Required since TRAI's 18 November 2025 direction. Untagged variables are now rejected Source: TRAI |
| People getting 3 or more spam SMS a day | 76%. 83% of people on the Do Not Disturb list still get them Source: LocalCircles survey, August 2024, 41,000+ responses |
| SMS click rate, India | 2.85% for broadcasts, 3.13% for journeys Source: MoEngage India benchmarks 2024 |
TRAI's connection counts are SIMs, not people, and from FY26 Airtel began counting machine-to-machine SIMs in its mobile base. Quote the figure without them when you mean people. For how templates, headers and variables work, see DLT registration and SMS templates.
Email marketing statistics
The honest answer on email open rates in India is that only one provider publishes an India figure, and every open rate is inflated by Apple's privacy feature. Click rate is the number to trust.
| Statistic | Number and source |
|---|---|
| Email open rate, India | 25.84%. Click rate 8.22%, click-to-open 31.81%, unsubscribe 0.09%. Based on 2023 sends by GetResponse customers Source: GetResponse 2024 benchmarks |
| Email open rate, Asia Pacific | 17.56% (26.69% counting Apple privacy opens). Click rate 1.46%. 2025 data Source: Brevo 2026 benchmarks |
| Email open rate, global | 20.73% (33.87% counting Apple privacy opens). Click rate 2.27%. 2025 data, 1,75,000+ customers Source: Brevo |
| Automated emails, global | Open rate 30.63%, click rate 7.39% Source: Brevo |
| Flows vs campaigns, global | Flows get a 5.58% click rate, campaigns 1.69%. Flows are 5.3% of sends and about 41% of email revenue Source: Klaviyo 2026 benchmarks |
| Ecommerce email, global | Open rate 29.81%, click rate 1.74%. Data last updated December 2023 Source: Mailchimp |
| Email conversion after a click, India | 4.21% for broadcasts, 7.75% for journeys Source: MoEngage India benchmarks 2024 |
| Apple's share of email opens, global | 62.26%, July 2026. Gmail: 27.03% Source: Litmus |
| Apple Mail Privacy Protection | Downloads images in the background, so emails count as opened whether or not anyone read them. Live since iOS 15, 20 September 2021 Source: Apple |
| Gmail bulk sender threshold | More than 5,000 messages a day to Gmail accounts Source: Google |
| Gmail spam rate | Keep below 0.10% and never reach 0.30% Source: Google |
| Gmail unsubscribe rule | One-click unsubscribe for bulk senders since 1 June 2024. Gmail stepped up enforcement from November 2025, including rejecting non-compliant mail Source: Google FAQ |
| Yahoo rules | Spam rate below 0.3%, one-click unsubscribe, unsubscribes honoured within 2 days Source: Yahoo |
| Microsoft Outlook.com | Senders of more than 5,000 a day need SPF, DKIM and DMARC. Non-compliant mail rejected since 5 May 2025 Source: Microsoft |
Two cautions on the India number. GetResponse counts every open, including repeats, and doesn't say how many Indian senders are in the sample. Its India click rate is more than twice its global one, which usually means a small sample. Use it as a rough guide, not a target. Apple's share of opens is lower in India than in Litmus's mostly Western data, because far more Indians read email on Android, so Indian open rates are less inflated than the global ones.
At PNG Jewellers, where I ran WebEngage, automated flows brought in 77% of CRM revenue. Why that number varies so much by category is in flows vs campaigns.

Push notification and app statistics
Push changed in 2022, when Android 13 began asking people for permission. Most push statistics pages still quote Android opt-in rates from before that, when every Android app had push switched on by default.
| Statistic | Number and source |
|---|---|
| Android push permission | Apps on Android 13 and later must ask before sending notifications. New installs start with notifications off Source: Android developers |
| Android web traffic in India on Android 13 or later | 78.8%, September 2026 Source: StatCounter |
| Median push opt-in rate | Android 53.3%, iOS 48.85%. 2025 data, global, 3 billion+ users Source: Airship 2026 benchmarks |
| iOS push direct open rate | Median fell 13.71% from 2024 to 2025 Source: Airship |
| Push click rate, India | Android 4.26% for broadcasts, 5.92% for journeys. iOS 1.95% and 2.55% Source: MoEngage India benchmarks 2024 |
| Push conversion after a click, India | Android 15.62% broadcast, 20.97% journey. iOS 6.99% and 19.32% Source: MoEngage |
| App day 1 retention, India | 38% across apps, 25% for shopping apps. iOS, October to December 2024 Source: AppsFlyer India festive report 2025 |
| App day 30 retention, India, top apps | Shopping 6.5%, finance 13.2%. iOS, October to December 2024 Source: AppsFlyer |
| Shopping app installs, India | 63% of global Android shopping app installs. India installs up 85% in two years Source: AppsFlyer India ecommerce report 2026, via MediaNews4U |
| Day 30 retention trend, shopping apps, India | Fell 41% between the last quarter of 2025 and the second quarter of 2026 Source: Same report |
| Apps built by Indian developers | 89,083 on Google Play, from 15,541 developers. February 2025 Source: 42matters |
| App downloads in India | 25.5 billion in 2025, across iOS and Google Play Source: Sensor Tower State of Mobile 2026, as reported by TechCrunch |
Read the AppsFlyer trend next to its other finding: remarketing spend on shopping apps fell 42% over the same period. Installs are growing faster than brands are working to keep those users. That's the retention gap in one line.
How many Indians have switched push off entirely isn't published by anyone. The nearest numbers are the opt-in rates above and StatCounter's Android split: on nearly four in five Android phones in India, push starts off until the person says yes.
Online shopping, payments and COD
| Statistic | Number and source |
|---|---|
| Online shopping (e-retail) GMV, India | $65 to 66 billion in 2025, growing 19% to 21%. Projected $170 to 180 billion by 2030 Source: Bain and Flipkart, How India Shops Online 2026 |
| Online shoppers | 290 to 300 million in 2025, about 30% of internet users Source: Bain and Flipkart |
| Quick commerce | $10 to 11 billion GMV in 2025, 16% to 17% of e-retail Source: Bain and Flipkart |
| Online share of all retail | About 8% of retail GMV in 2025, expected to reach 14% to 15% by 2030 Source: Redseer report in Shiprocket's IPO filing |
| Direct commerce (brands' own sites and apps) | ₹74,000 to 91,400 crore ($9 to 11 billion) GMV in 2025 Source: Same Redseer report |
| UPI | 24.07 billion transactions worth ₹29.37 lakh crore in September 2026. Volume up 23% on September 2025 Source: NPCI data, via DD India |
| Cash on delivery, one large marketplace | 72% of Meesho's shipped orders, April to September 2025. 85% in FY24 Source: Meesho IPO filing, via MediaNama |
| Return to origin (RTO), D2C brands | 39.2% of shipments in November 2025, 25.6% in January 2026, 21.0% in March 2026. All payment types together Source: Unicommerce India D2C Report, 6,000+ brands |
| Repeat customers, one shipping network | 57.78% of end customers bought again in FY26, up from 46.79% in FY24 Source: Shiprocket, in the same Redseer report |
| Repeat rate by category, D2C | Beauty and personal care 30%, fashion 28%, electronics 14%. 2023, period not stated Source: GoKwik network data, via Startup Story |
Two things to watch. Bain and Redseer measure online retail differently, so don't add their numbers together or compare one with the other. And the COD and repeat figures each come from one company's own platform: useful, but not the whole of India. For what repeat rate to aim for in your category, see what a good repeat purchase rate is. For what COD and RTO do to your margin, see CM1, CM2 and CM3.
How many D2C brands and CRM platforms are there in India?
Nobody has counted India's D2C brands properly. The numbers you'll see depend on who's counting and what they count:
- 1,500+ brands in d2cstory's directory, which lists brands selling through their own website or app (September 2026).
- 6,000+ brands in Unicommerce's dataset for its D2C report (April 2026).
- 500+ "notable" brands in Inc42's D2C tracker, last updated December 2021. The widely quoted "800+ D2C brands" traces back to the same era, with no method I could find.
The tools those brands use to talk to customers haven't been counted either, so I counted them. In October 2026, I checked 30 customer engagement and messaging platforms that sell to Indian brands, on each vendor's own site and Shopify App Store listing.
| Type | Platforms |
|---|---|
| Full engagement platforms (journeys across email, push, SMS, in-app and more) (7) | MoEngage, CleverTap, WebEngage, Netcore Cloud, Braze, Insider One, Salesforce Marketing Cloud |
| Email-first, adding SMS and WhatsApp (8) | Klaviyo, Omnisend, Brevo, Mailmodo, Shopify Messaging, HubSpot, Zoho Marketing Automation, Freshmarketer |
| WhatsApp-first commerce tools (7) | Kwik Engage, Interakt, AiSensy, Wati, Zoko, BiteSpeed, LimeChat |
| Messaging providers (APIs, few or no journeys) (8) | Gupshup, MSG91, Exotel, Route Mobile, Karix, Kaleyra, Plivo, Fyno |
What the count shows:
- Most prices aren't public. Only 6 of the 22 marketing tools show a starting price on their own pricing page. For several more, the Shopify App Store listing is the only public price.
- The enterprise end is quote-only. MoEngage, Netcore, Braze, Insider and BiteSpeed publish no price anywhere I could find. CleverTap is the only full engagement platform with a list price on its own site.
- Almost everyone bills in dollars. AiSensy and Fyno were the only ones showing rupee prices.
- A third of the marketing tools are WhatsApp-first. 7 of 22, and most have since added Instagram, voice or RCS.
- RCS is everywhere now. 11 of the 30 list RCS, Google's richer replacement for SMS.
If you're choosing one, how to choose a CRM for a D2C brand walks through it, and my reviews of MoEngage, CleverTap, WebEngage and Kwik Engage go deeper.
Consent and the law
| Statistic | Number and source |
|---|---|
| Data protection rules notified | 13 November 2025, under the Digital Personal Data Protection Act 2023 Source: PIB |
| Phased compliance | 18 months. Consent managers from 13 November 2026. Notice, consent and user rights from 13 May 2027 Source: PIB, and the rules as published |
| What consent must be | "Free, specific, informed, unconditional and unambiguous", with a clear affirmative action Source: DPDP Act, section 6(1) |
| Withdrawing consent | Must be as easy as giving it Source: DPDP Act, section 6(4) |
| Highest penalty | Up to ₹250 crore, for failing to protect personal data Source: DPDP Act, Schedule |
| Repeat spam offence, SMS and calls | Disconnection of all the sender's connections across all telecom operators for a year, plus blacklisting Source: TRAI |
| After an opt-out | A sender can't ask the same person for consent again for 90 days Source: TRAI |
For a retention team, 13 May 2027 is the date that matters: from then, every marketing list needs consent you can prove, and an opt-out as easy as the sign-up. If your WhatsApp and SMS lists were built from checkout numbers without a clear opt-in, start fixing that now.
What nobody publishes
These are the numbers people ask for most that don't exist anywhere with a source. If you see them quoted, ask where they came from.
- WhatsApp users in India. Meta stopped giving an India number after 2019, and in 2023 said it doesn't break the number out. The 853.8 million figure that shows up in Google's AI answers comes from a data aggregator, not Meta.
- WhatsApp open rate in India. No study with a stated method covers India. The only measured benchmark is Chatarmin's 72% median, from brands using a tool focused on German-speaking markets.
- How many marketing messages one person can receive on WhatsApp. Meta sets it per person and doesn't publish it.
- How many people in India have switched off push notifications. Not published by any platform or survey I could find.
- The number of D2C brands in India. There are directories and datasets, not a count.
- The share of all Indian online orders paid by COD, and RTO rates split by COD and prepaid. Only single-platform figures exist.
- Repeat purchase rates by category for India, with a stated measurement window.
- How many businesses are registered on DLT, or how many templates. TRAI publishes enforcement numbers, not registrations.
Numbers other pages get wrong
| What many pages say | What's true in 2026 |
|---|---|
| WhatsApp has a 98% open rate | No source with a method. Measured median: 72% Source: Chatarmin |
| WhatsApp charges per conversation | Per delivered message since 1 July 2025 Source: Meta |
| WhatsApp API broadcasts are unlimited | Capped by daily limits per business and by a per-person cap on marketing messages Source: Meta |
| The average email open rate in India is 42.4% | That figure matches MoEngage's global number for behaviour-based emails, not an India average. The one India figure is 25.84% Source: MoEngage, GetResponse |
| Android turns push on automatically, so opt-in is 81% to 85% | Android 13 and later asks first. Median Android opt-in is now 53.3% Source: Android, Airship |
| India has 853.8 million WhatsApp users | Not a Meta figure. Meta's last India number was 400 million+ in 2019 Source: TechCrunch |
How to cite this page
Quote any number with its original source, and link this page as where you found it:
Copy and paste
Source: Compound Lab, "WhatsApp, Email, Push Statistics India 2026", compoundlab.in/blog/whatsapp-email-push-statistics-india, checked October 2026.
The full dataset, with every number, its source link and the date it covers, is a free CSV download. Charts on this page can be reused with a credit and a link.
I update this page every quarter, because Meta's rates can only change on 1 January, 1 April, 1 July and 1 October, and TRAI publishes its spam numbers each quarter.
What these numbers mean for a D2C brand
Put the page together and three things stand out. Messages are getting more expensive and more restricted on every channel: Meta caps marketing per person, Gmail rejects careless senders, Android asks before push, and TRAI disconnects spammers. Automated journeys beat broadcasts on every channel that measures it. And the first month after install or purchase is where most customers are lost.
So the brands that do well send fewer, better-timed messages to people who asked for them. If you'd like help working out what that looks like for your brand, book a call with me.
FAQ
How many WhatsApp users are there in India? Meta hasn't published an India number since July 2019, when WhatsApp said it had more than 400 million monthly users in India. A government press release in February 2021 gave 53 crore, based on third-party data. Higher figures, such as 853.8 million, come from data aggregators, not Meta.
What is the average email open rate in India? The only published India figure is 25.84%, from GetResponse's customers' 2023 sends, with an 8.22% click rate. Open rates everywhere are inflated by Apple Mail Privacy Protection, so click rate is the more reliable measure.
What is the open rate of WhatsApp marketing messages? The only study with a stated method found a median read rate of 72% across 414 brands using Chatarmin, a WhatsApp tool focused on German-speaking markets, in 2025 and 2026. The 98% figure on many vendor pages has no published method.
How many marketing messages can a WhatsApp user receive in a day? Meta doesn't publish a number. It limits marketing messages per person based on how much that person reads them, and a message blocked by the limit fails with error 131049. A business's total daily reach is set by its messaging limit: 250, 2,000, 10,000, 1,00,000 or unlimited people a day.
What is the push notification opt-in rate? Airship's 2026 benchmarks put the median opt-in at 53.3% on Android and 48.85% on iOS, using 2025 data. Android 13 and later ask for permission, so older figures of 80% or more for Android no longer apply.
How many D2C brands are there in India? No official count exists. d2cstory's directory lists 1,500+ brands and Unicommerce's dataset covers 6,000+, but they count different things. The "800+" figure often quoted dates from around 2021 and has no published method.
What is the average app retention rate in India? AppsFlyer's India festive report found 38% of iOS users came back on day 1 across apps, and 25% for shopping apps, in October to December 2024. By day 30, top shopping apps kept 6.5%.
Can I use these statistics? Yes. Quote each number with its original source and link this page as where you found it. The full dataset is a free CSV download.
Update log
- October 2026: first edition, 60+ statistics checked between 1 and 13 October 2026.